
Flutter Charts - Data Visualization with Line Chart, Pie Chart and Bar Chart
by HeyFlutter․com youtube.com
3 min 25.2k views
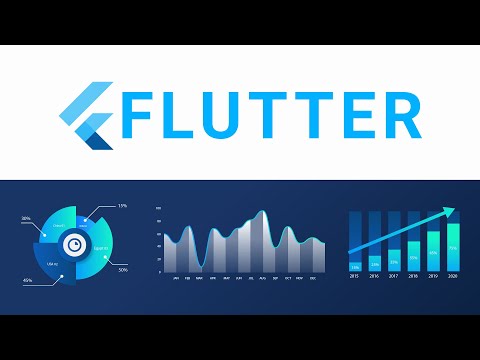
Learn how to make Line Chart, Pie Chart and Bar Chart in your Flutter app by using FL Chart package and elevate data visualization with captivating visuals. 👉 12 Week Flutter Training | https://heyflutter.com 👉 Flutter Masterclass Courses | https://heyflutter.com/masterclass Source Code: https://github.com/JohannesMilke/flutter_fl_chart_package Twitter: https://twitter.com/HeyFlutter_ Facebook: https://www.facebook.com/heyflutter Instagram: https://instagram.com/HeyFlutter_ LinkedIn: https://www.linkedin.com/company/heyflutter/ Website: https://heyflutter.com #Flutter #Tutorial #HeyFlutter Thanks For Watching :-)
More like this
- Article 3 min read
The Toolbox - Charts for Flutter
Flutter Sensei shows you how to use the charts_flutter library in your project.
Read on fluttersensei.com  Article 7 min read
Interactive Charts In Flutter
 by
Ionicfirebaseapp
, on Flutter Pro
Ionicfirebaseapp
@ionicfirebaseapp 🇮🇳 India
Available for hire
www.ionicfirebaseapp.com is the innovative marketplace for Mobile app, Web app, Backend on the newest trending technologies and tools. We are technologies agnos...
View Ionicfirebaseapp on Flutter ProInteractive Charts in Flutter allow you to create dynamic visualizations that bring your data to life
Read on medium.com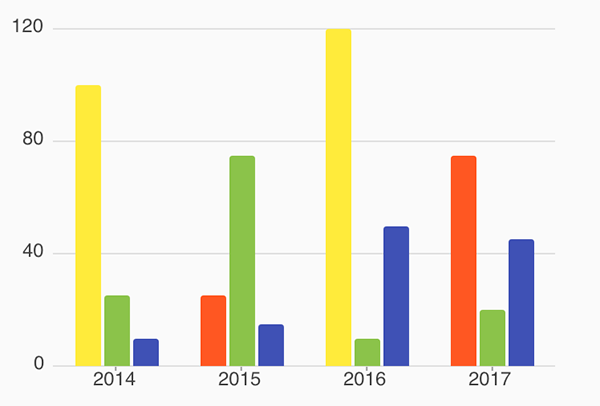 Article 4 min read
Beautiful, animated charts for Flutter
by Michael Thomsen
We are super excited to announce a fully-featured, animated charting library for Flutter!
Read on medium.com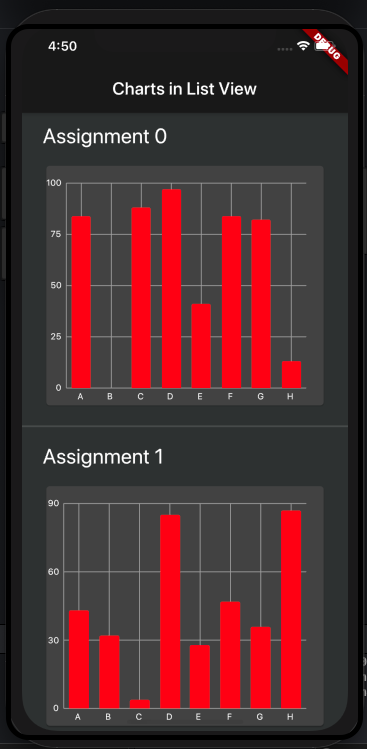 Article 5 min read
Displaying a list of charts in Flutter
by Indresh Arora
A simple 6 step tutorial to develop a list of charts in Flutter.
Read on medium.com


